Yes, obviously, ICE out as well. Because f&%$ those cowardly, anti-American f&%$s.
But today we’re going to be talking about Ice Out, the time-honored tradition in the Northeast Kingdom of Vermont of predicting the date and time that Joe’s Pond in West Danville finally thaws.
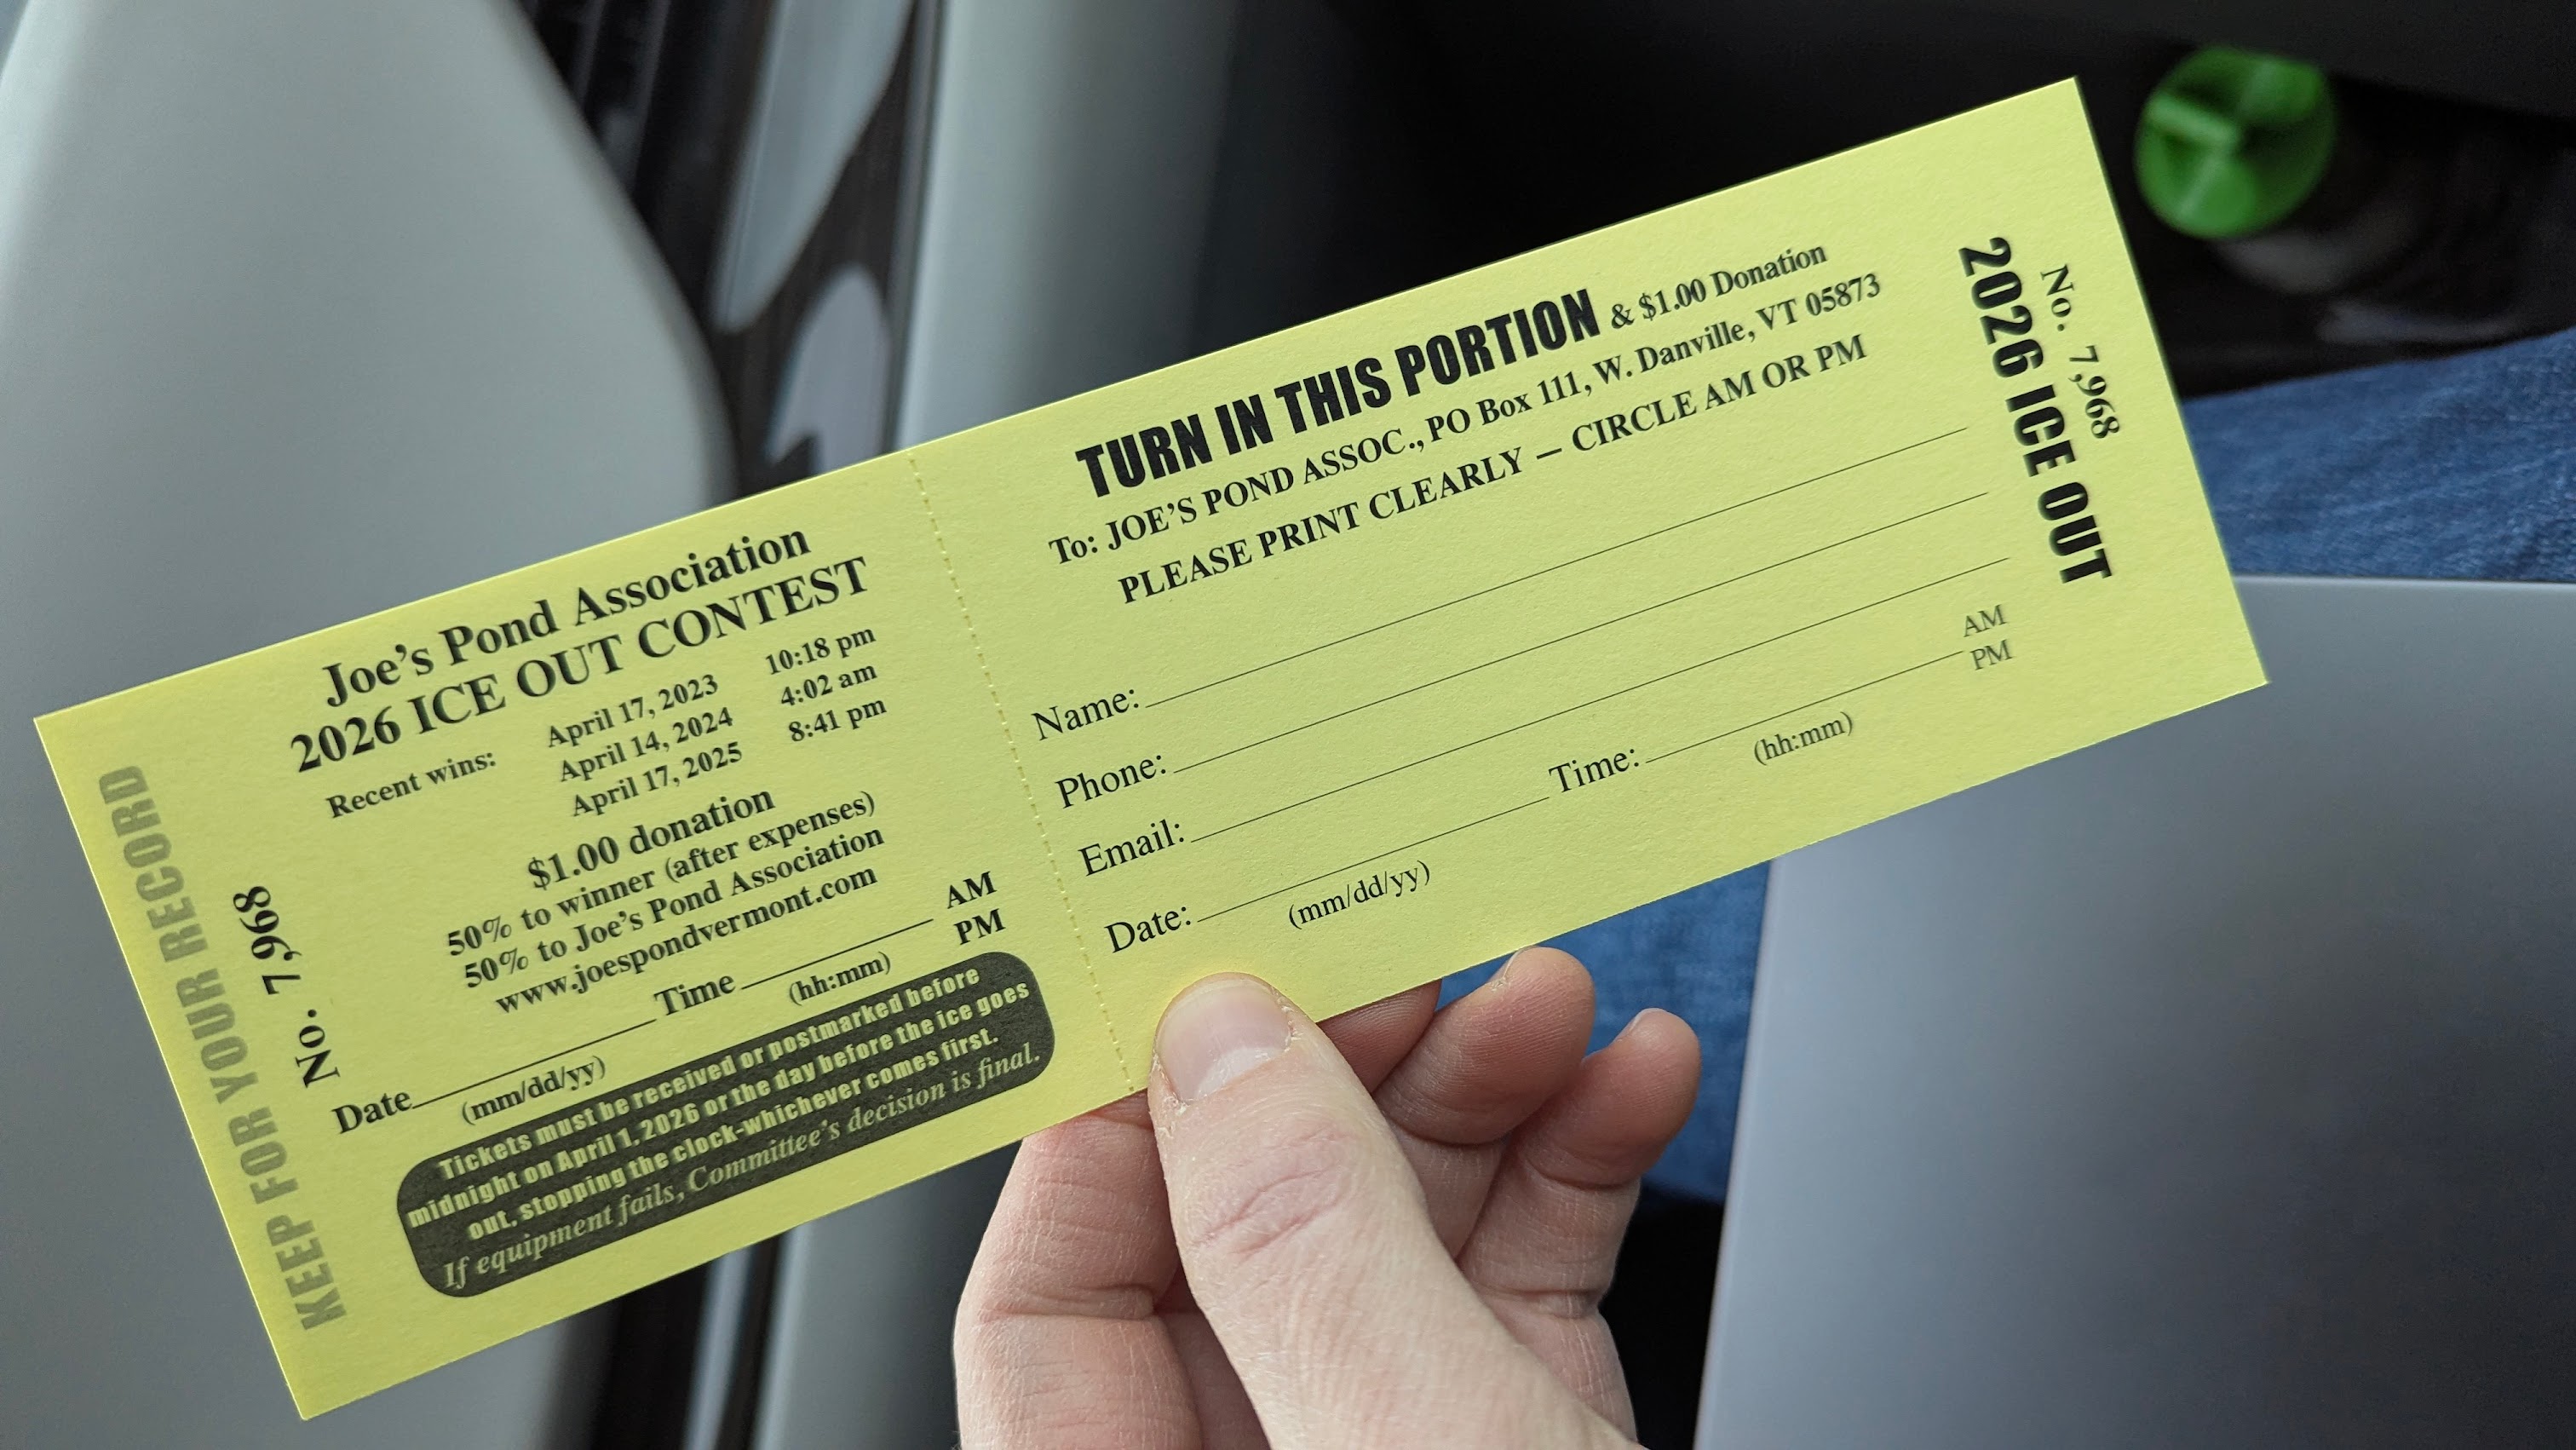
Throwing a dart at the calendar
The challenge is simple: stop into the West Danville General Store, scrawl your prediction on one of these tickets, pay a buck per prediction, then wait for Spring. Last guesses are due on April 1, i.e. today. At some point, the ice gets thin enough that a sledge weighed down with cinderblocks plunges through, pulling the battery out of a tethered clock on shore and preserving the time of day. Winner gets half of the pot, and the rest goes to the local activities fund.
Danville is a uniquely-cold place in a uniquely-cold corner of a uniquely-cold state. High on the Kingom plateau, the town and its surroundings get wind-blasted all through the winter, and the landscape can give off vibes of being cryogenically preserved until as late as June. Which is part of the fun of the Ice Out predictions - from anywhere else in New England you might be forgiven for assuming that it’s already summer, while snowmobiles are still being revved across the surface of Joe’s Pond.
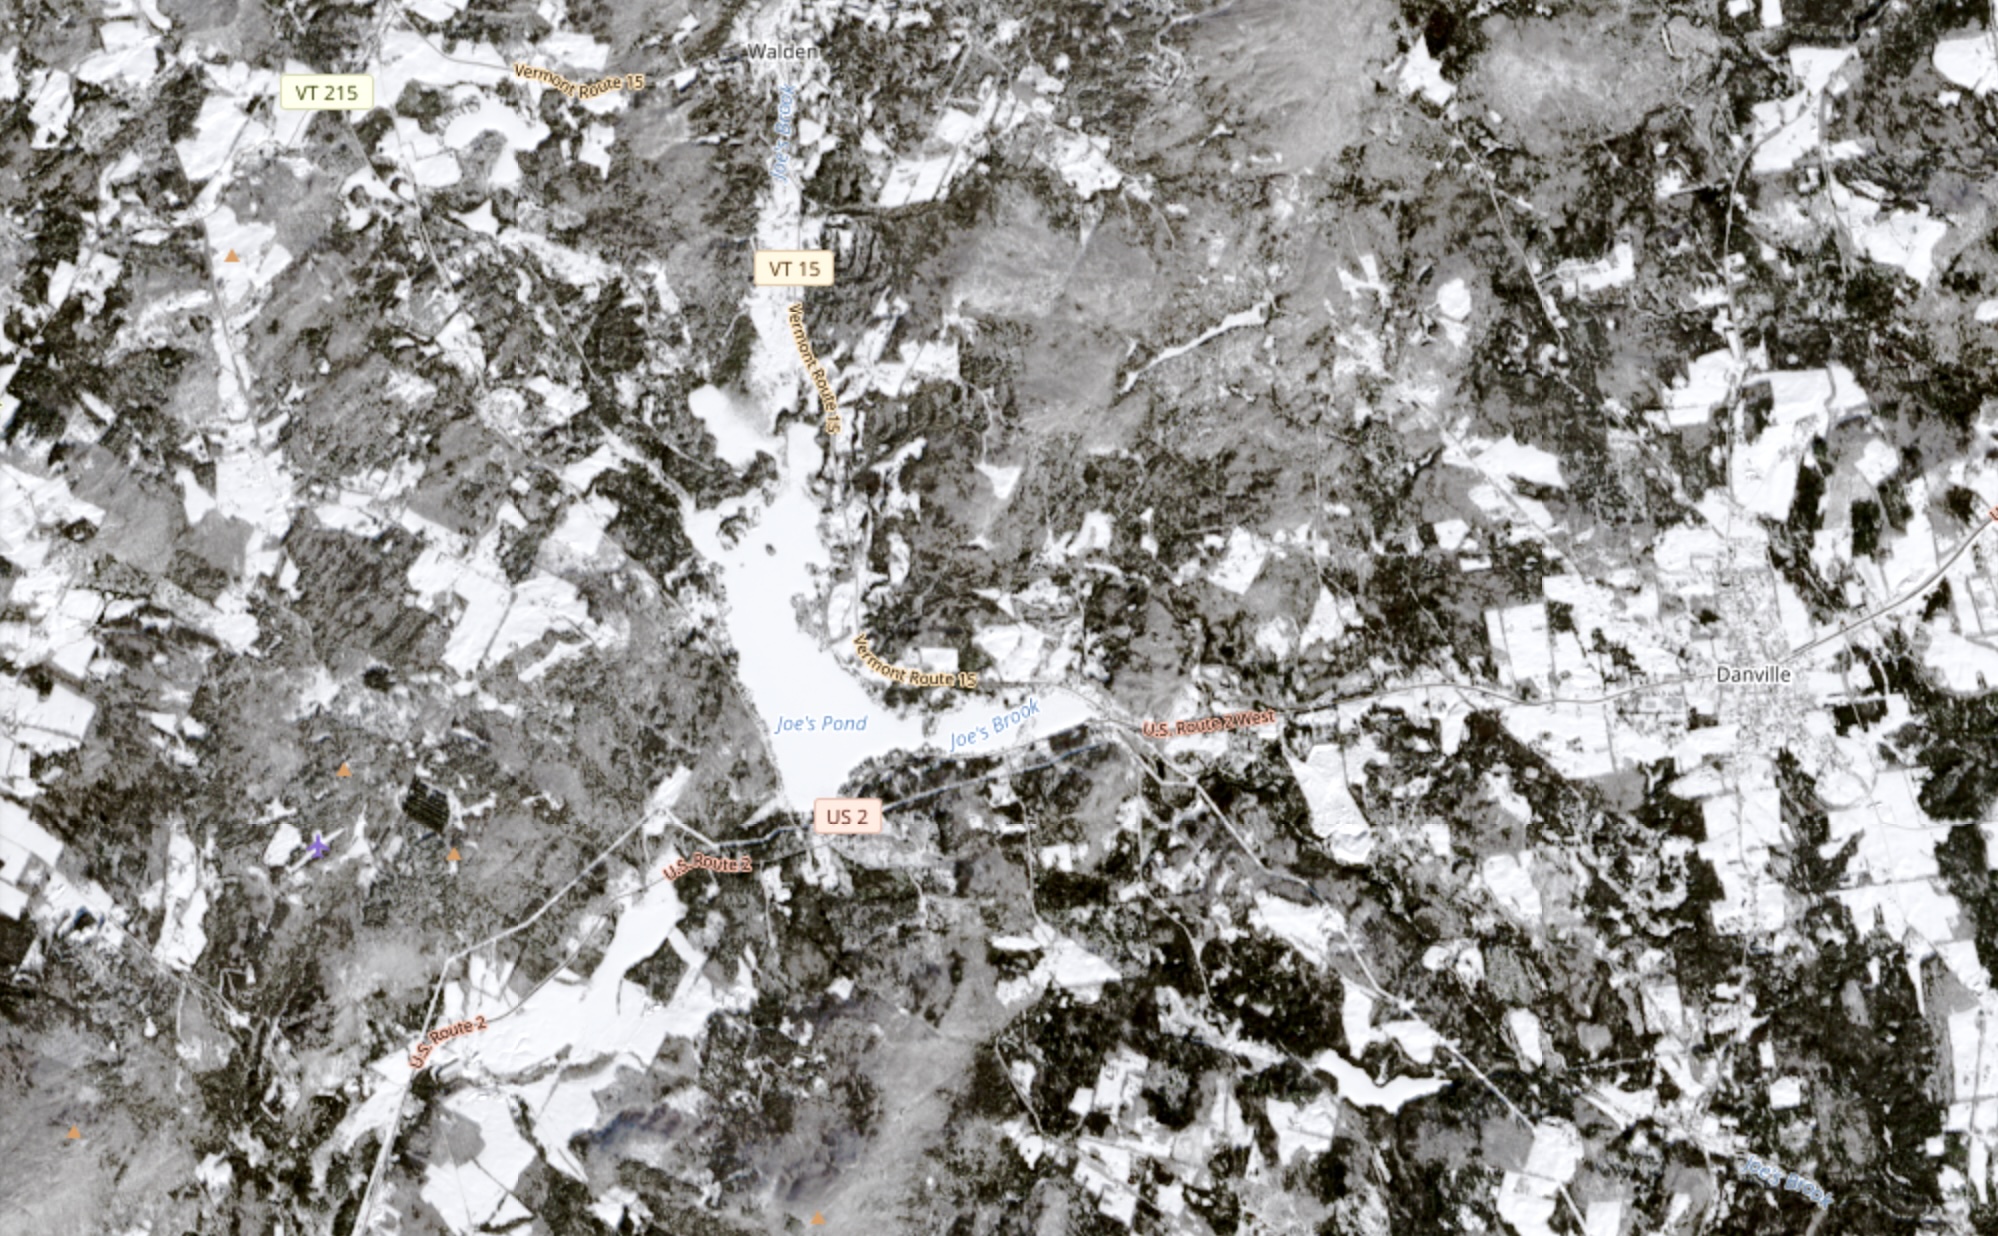
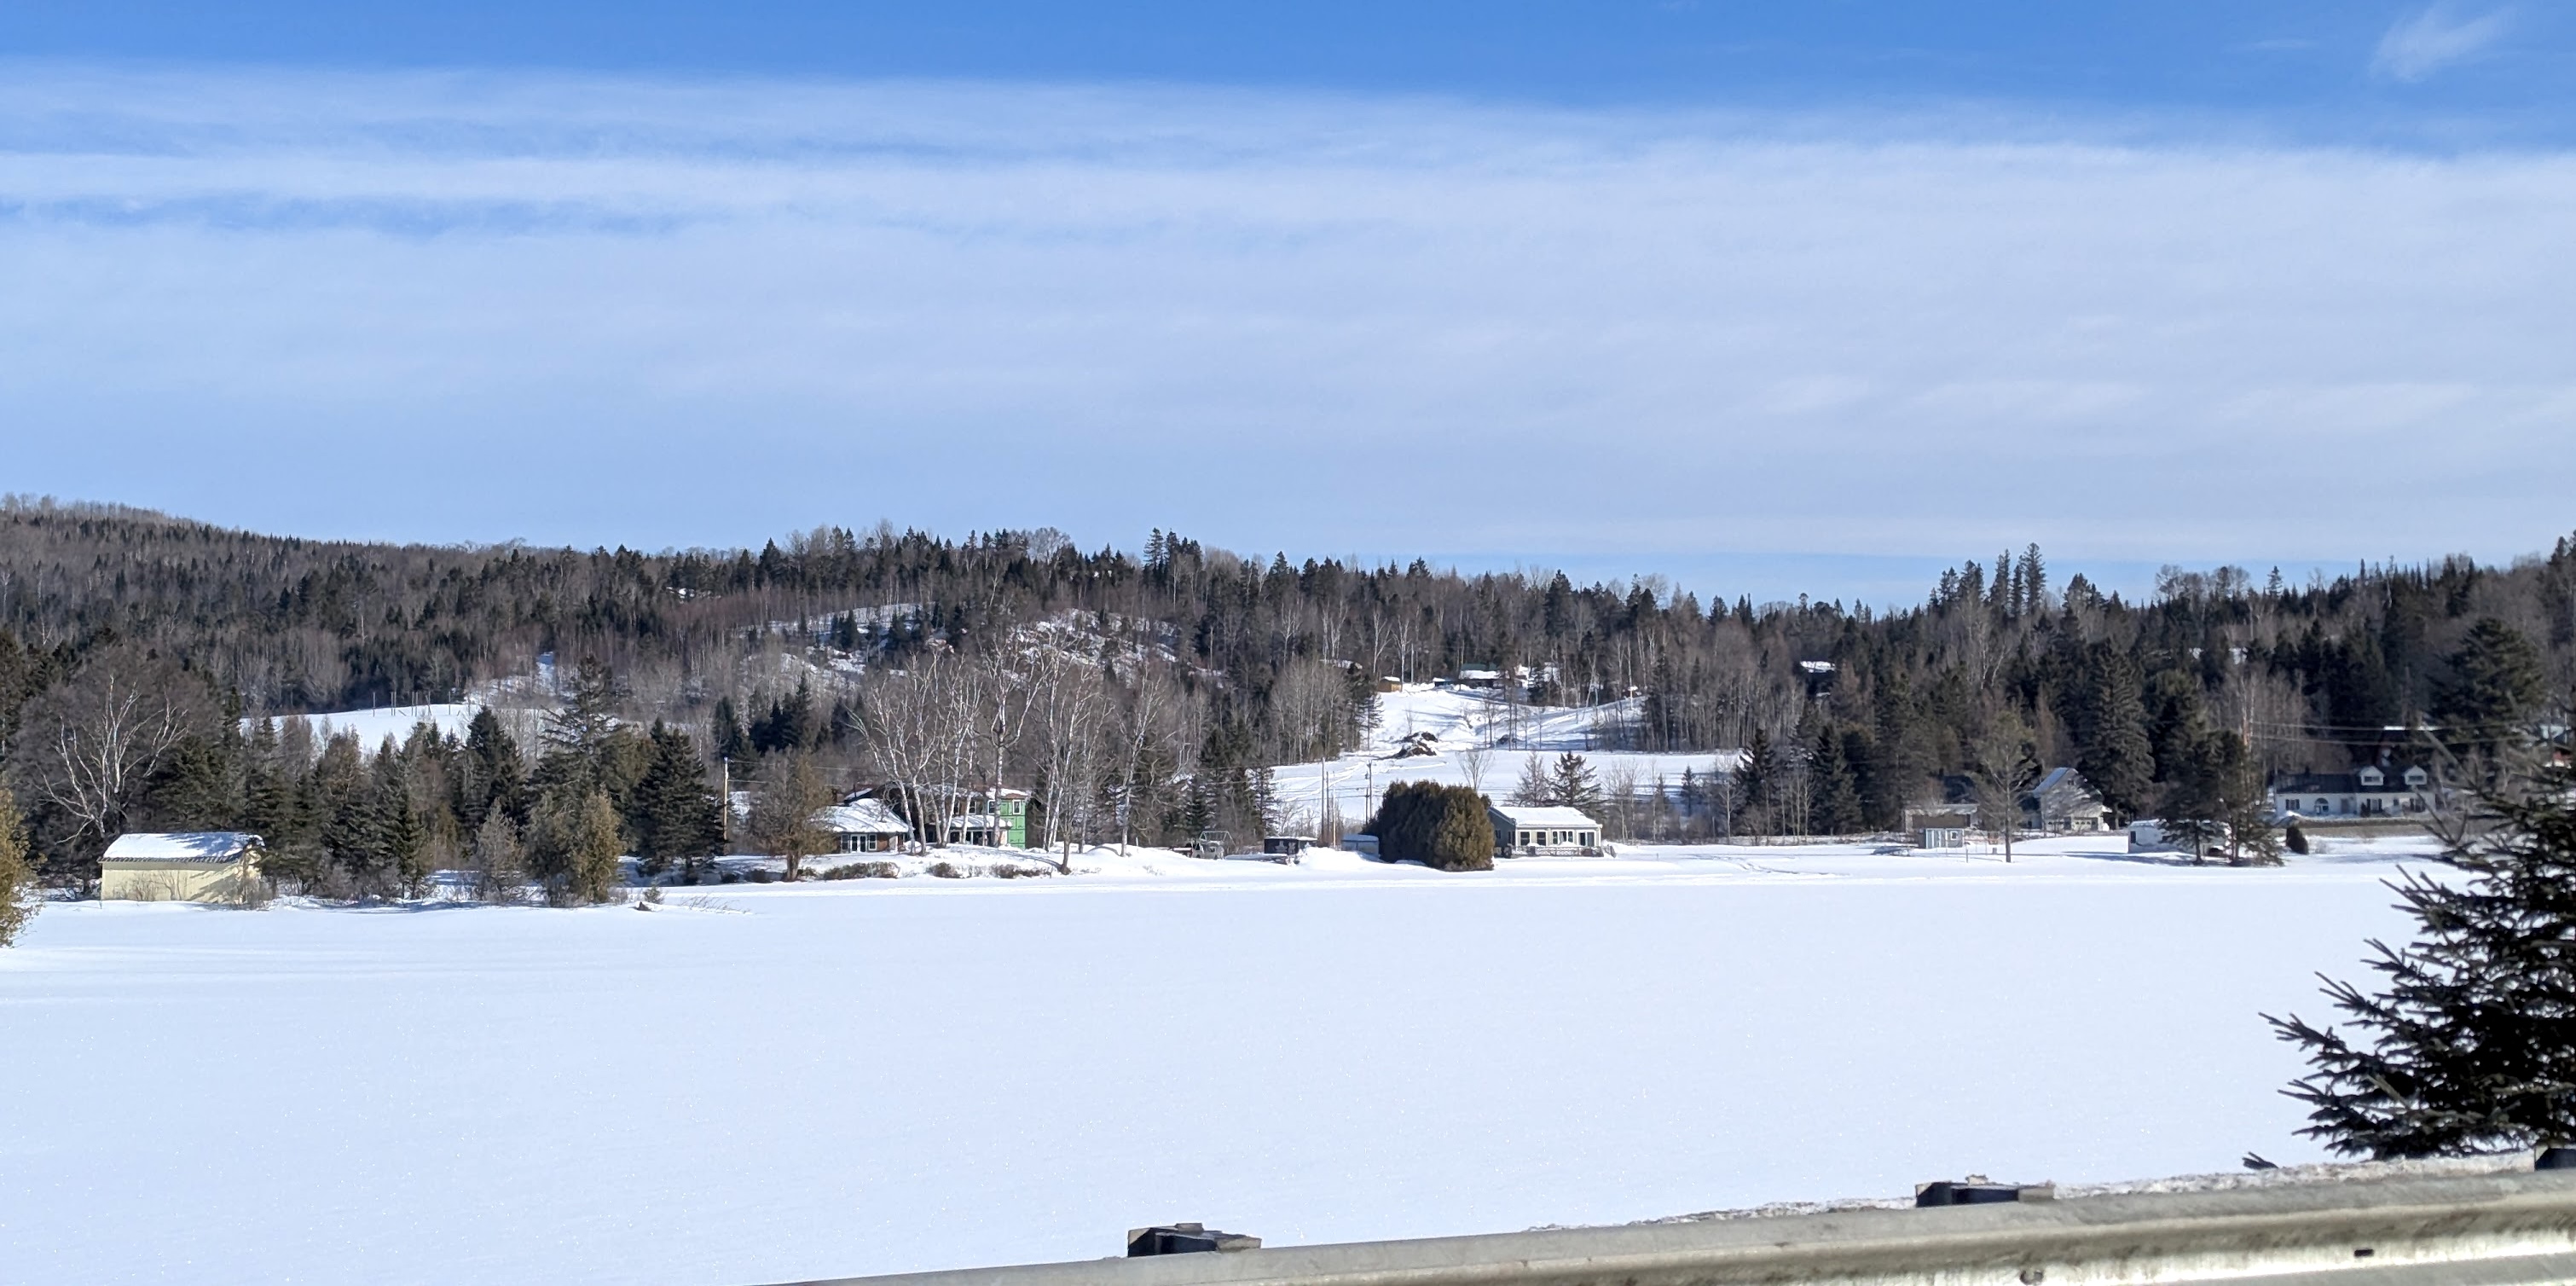
ESA Sentinel-2 image of Joe’s Pond, frozen solid as an ice cube on February 15, 2026
It might as well be a shot in the dark from year to year, guessing when the ice will go. Even as the climate warms, the old-timers probably can still “feel” the ice’s longevity, but for us mortals it can feel pretty random.
But is it? Let’s find out by building a predictive model!
Skipping “Why?”, let’s try “How?”
On the Joe’s Pond webpage, there is a helpful record of winning dates and times going back to 1988. From a statistical standpoint, this is a wicked small sample size, buddy, but we can put some guardrails around it to maximize information gain. So that’s our training set - 38 observations. Why not just take the averages and submit those? The answer is both “weather” and “climate”. The ice out from last year might be a better predictor for 2026 than the ice out from 1991, because our big macro patterns all show measurable warming in Northern Vermont over the past four decades. But any single year is going to be subject to some pretty big error bars, particularly as the climate gives us wilder stretches.
But there are other ways of looking at what “wild” means from year to year, and other ways of looking at how an ice pack forms and breaks. Here’s my hypothesis going in:
A selection of measured and modeled climate variables from the three months leading up to April can be used to predict the eventual ice out date and time of Joe’s Pond.
This is my hunch because I think the character of a specific winter matters more to the final prediction than when the ice went out three, twelve, or twenty years ago. I suspect that the one week of deep freeze in February, or the massive rainstorm in late March, have a detectable impact on the result.
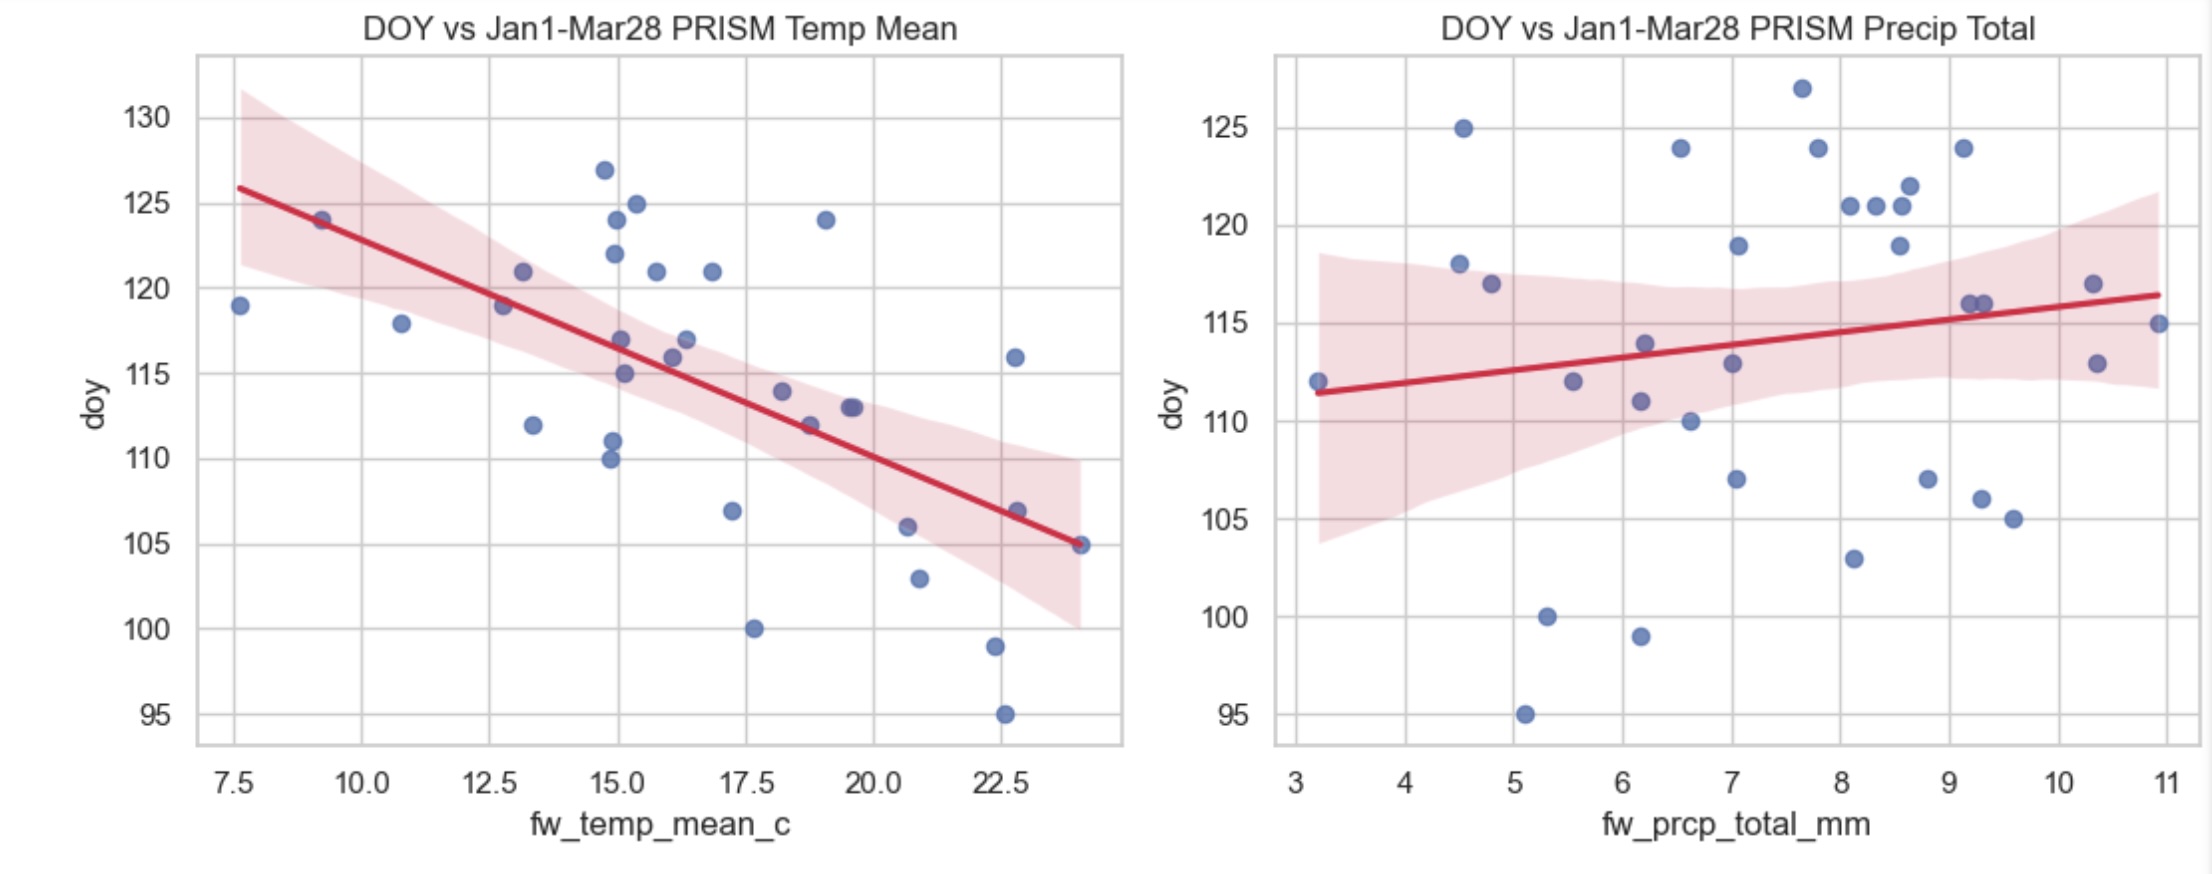
Fortunately, data for all of that exists, back to 1988 and beyond. There are weather stations around the region, with records for temperature, pressure, precipitation, etc, that in some cases go back more than a century. In perusing these I found the closest stations to have data gaps, and more distant ones can be difficult to weight. But the PRISM group at Oregon State University has already done the work of smoothing all of this out: they model and provide historical, daily climate observations for the whole country going back to 1981. While it’s always a tiny bit dodgy to make a predictive model based on already-modeled inputs, this is really the most consistent set of records out there. Using these, I pulled out some features that I thought might characterize a winter leading up to ice out:
- Average daily temperature over the window (January through March)
- Day-to-day temperature variability
- Cumulative cold intensity (sum of degrees below 0C)
- Cumulative warmth (sum of degrees above 0C)
- Total precipitation
Then, because this is such a small sample size of years, I discarded all the fancy ML approaches and used two modeling tactics: An Ordinary Least Squares (OLS) linear regression, aggressively cross-validated with leave-one-out selection. Here, I put it all in a python notebook for your perusal and amusement.
Stop hedging, give me the results already
Fine. April 25, 2026, at 6:32 AM
That’s it?
Of course not. Another likely contender is April 24, 2026, at 8:51PM.
To get more specific, these two predictions were made to try both versions of an assumption: that date and time of ice out are independent of each other. The April 24 prediction is the result of a model that assumed dependence between the variables, and calculates a fractional day of year: 114.87. The April 25 result, on the other hand, assumes that date and time are separately influenced by the character of the winter, and so they’re predicted separately. A side note is that the time of ice out cannot be independently predicted from these variables; the cross-validation shows that every regression built performs worse than the historical mean, so here we’re just using that: 6:32AM.
The error bars for both of these are wide, like, 15 days on each side. This is, as I hope I made clear earlier, a silly exercise.
Anything else interesting in the data?
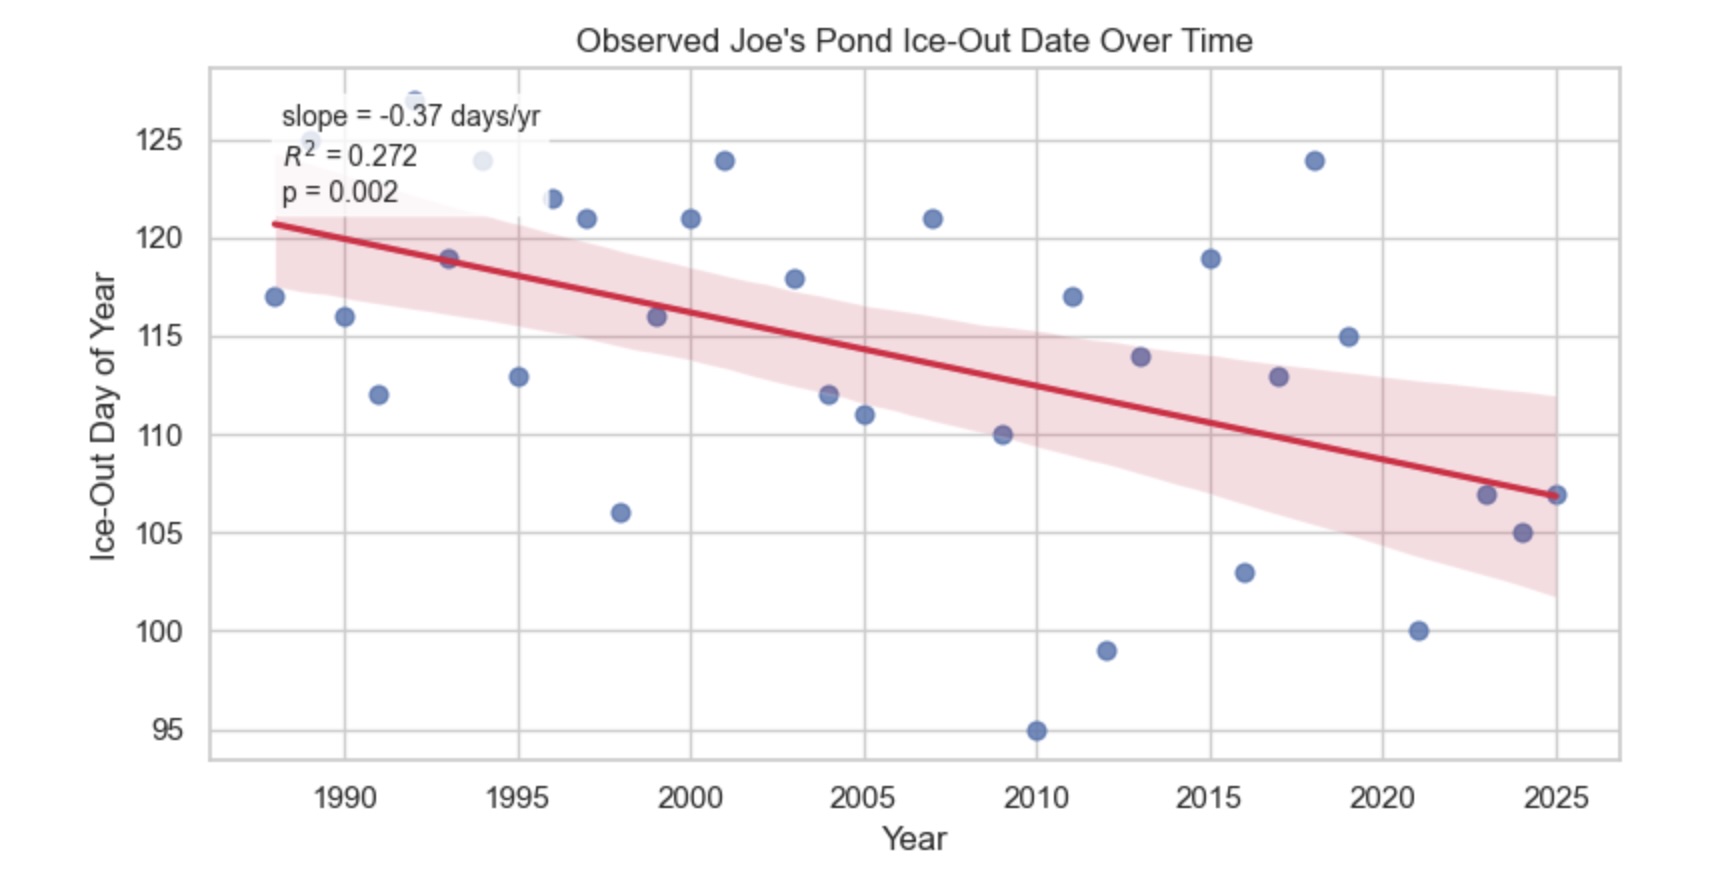
Climate change is real. While the time of day is all over the place, the day of year has been moving inexorably earlier throughout the timespan of the contest. Over the long haul, Joe’s Pond ice out is about 8 hours earlier every year.
Now what?
Now we wait. I’ll update this post when the clock finally stops.
The big update!
April 16, 2026, at 6:21AM
I was off by nine days, which is well within the error bars of the analysis above, but it’s very clear how hard this is to do. Interesting that the time of day was almost dead-on, but horseshoes, hand grenades, etc, etc . . .
Congrats to the winner! [yet unnamed as of this posting]]